YIELD MORE: INCOME BETWEEN 3% AND 6% IN A LIQUID PORTFOLIO. WHAT, WHY, AND HOW. 1H 2023 EDITION.
As of this update of "Yield More", cash-like instruments such as high yield savings and other cash like instruments earn between 4% and 5% before tax, and about 3.3% after tax, although they have no promise of growth. After inflation, most of these investments lose money, currently. If you want more yield, and still want near-instant liquidity, read on.
WHAT YOU SACRIFICE TO GET HIGHER YIELD PLUS LIQUIDITY
Below we will look at options for higher current income and high liquidity/quick access. The rule here is that when you want higher income with growth, you are signing up for less downside principal protection.
However, sometimes income just matters more than principal protection.
Example: I have a friend who was obsessed with replacing his cost of living through investment income so that he could quit his job. In his case, focusing on his current income stream was necessary to get the emotional freedom required to quit, and he was able to leave his job much sooner than if he'd parked his money in safer investments.
Before you do this, I strongly recommend you set up an emergency fund that will deal with any surprise cash needs.
And then, be prepared to close your eyes while collecting your interest and dividends, because the value of your investment will move around a lot...not as much as stocks, but a lot more than the Ultimate Liquidity Portfolio.
How volatile are these investments? Some of these investments lose 20% or more when the environment turns bad. We'll talk about how they performed under prior periods of stress to get you emotionally ready. One positive caveat: although the quoted value of the investments has been volatile, the income streams provided by the investments have been relatively stable, as noted at the end of this article.
Diversification Improves Principal Protection
A great way to offset some of your downside risk in these investments is to combine multiple types that are exposed to different risks/aren't as correlated to each other. You can do this on your own or by buying a mutual fund that does it for you.
Here are some of the assets that generate higher yields and why:
1. Preferred Shares. Current income = 6.33 %. Example ETF = PFF.
Preferred Shares are a hybrid between debt and equity (bonds and stocks) in a company. The income on these must be paid before a company pays dividends to people lower down the food chain (including regular stocks). The performance tends to be more correlated to the performance stock market. While the shares are generally more stable than normal stocks, in the global financial crisis of 2007-2009, preferred shares lost about 40% of their value, and took 32 months to recover. In the more recent COVID bear market, it lost 16% of its value. In 2022, PFF was down as much as 19.7%. While this compares favorably to stocks (which lost about 50% and took 53 months to recover in 2008, and dropped about 25% in the 2022 bear market), there's no hiding the fact that it was devastating if you needed access to your principal during the downturn.
The upshot is that preferred shares kept paying out dividends during and after the 2008 crisis and remain strong today. A $10,000 investment in 2006 in a preferred share fund would have yielded about $500, an amount that has grown in most years, and is about $1000 today. The value of your principal has also grown.
Convertible bonds. Current Income = 3.67%. Example ETF = CWB.
Convertible bonds are another hybrid between debt (bonds) and equity (stocks). Convertible bonds usually have a lower interest rate than normal corporate debt, with an option to “convert” to the stock of the company at a predetermined price. I used to include convertible bonds in this portfolio, however, the yields have dropped dramatically enough that it would not make sense to invest new money in them for this portfolio.
Senior loans. Current Income = 7.75%. Example ETF = BKLN.
Senior loans are loans issued to corporations that are paid before other loans. They tend to be short term in nature. In theory this sounds good, but in many cases the underlying corporations are shakier than average businesses. Senior loans performance is driven by short term interest rates.
Crisis years in the senior loan industry have meant losses of about 15%-20% of principal, bad periods on the order of 5%-10%. This is safer than the other investments we've mentioned so far, however, their income has not meaningful grown during this time. Senior loans are more of a "pure debt" instrument without high potential for growth.
During the COVID crisis, BKLN lost 9.27%, and during the 2022 inflation crisis, it lost 6.73% of its value. Current yields are relatively high vs historical.
Corporate bonds. Current Income = 5.25%. Example ETF: LQD
Instead of lending to the government, you can lend to corporations. You lose some of the iron-clad guarantee of the US Treasury, but many people still feel comfortable loaning to companies like Coca-Cola, Microsoft, AT&T and more. The companies must pay interest on debt before making payments on stocks, preferred shares, or other ownership stakes.
Because they are backed by steadier corporations, this asset tends not to have extreme drawdowns. Crisis periods have meant 15%-25% losses, with the 2022 inflation crisis driving an extreme -23% drawdown, and a more typical bad year has meant losses of 5% or so. At the current rates, bonds are not yielding significantly more than savings accounts.
Junk Bonds. Current Income = 8.32%. Example ETF = JNK.
An interesting sub-type of corporate bonds is known as a “junk” bond. A junk bond is debt issued to a company that is less financially stable (think young tech company instead of Coca Cola), and therefore pay an even higher interest rate than standard corporate bonds. Historically junk bonds have returned about 2%-3% more than their higher grade corporate brethren.
Junk bonds are subject to wilder swings in value, with a crisis period meaning losses of 25%-35%, and "bad periods" have meant losses of 5%-10%. The COVID crisis loss of 12.7% took about 11 months to recover. In the 2022 bear market, junk bonds lost up to 16.2% of their value.
Similar to other loan products, there is some concern that the quality of corporate loans has decreased.
Emerging market government debt. Current Income = 6.83%. Example ETF = VWOB.
You can lend to other governments besides the United States government, and governments in developing/emerging markets pay significantly higher interest rates than the US does.
Emerging market debt had a period of extraordinary performance for several decades as it was a small and emerging asset class. Historically the bonds earned 3-5% more than equivalent US bonds. However, as these emerging markets have "grown up", they simply don't need to pay such high interest rates.
Crises are a bit hard to predict. The governments have become more stable so the shocks tend not to be severe. In the late 1990s, the Asian crisis caused the bonds to drop more than 40%, and they dropped more than 20% in the global financial crisis. More recently, bad years have been on the order of a 7%-10% loss of principal, recovered in 12-18 months. The COVID crisis caused a drop of 14.1%, and the 2022 inflation crisis has caused a drawdown of about 25%.
Mortgage backed securities. Current Income = 3.31%. Example ETF = VMBS.
In the US, entities like Fannie Mae issue debt that is guaranteed by the US government. Like US Treasuries, they are only taxed at the federal level. You typically get a slight bump in return vs. similarly aged treasuries. An example ETF is VMBS.
Due to their federal backing, these bonds historically rarely lost more than 2%-3% in principal value, recovering within 12-18 months. They tended not to appreciate in value. However, during the 2022 inflation shock, VMBS has lost over 15% since its high, calling into question its conservative credentials. Because of its current low yield relative to other fully protected options, it would not make sense to put new money into VMBS for yield purposes.
Higher dividend stocks. Current Income = 3.01%. Example ETF = VYM. OR International dividend stocks Current Income = 4.42%. Example ETF = SCHY.
The average dividend yield of the US stock market is just under 2%, which is a composition of stocks that pay no dividends all the way to stocks that pay the highest dividends. Several ETFs specialize in higher dividend yielding stocks.
There are many twists on this theme - for example you can invest in a particular industry; utility stocks and real estate stocks are often used in this strategy as they tend to pay higher dividends.
Two important things to note about higher dividend stocks. 1) They are not always insulated from the wild swings of the stock market. 2) out of this list, they have the longest history of growing the amount they pay you over time. If your goal is to have long term growing income, investing in dividends can be an amazing and patient way to accomplish your mission.
For example, if you bought $10,000 of VYM in 2007, you would have received $265 in dividends – or 2.65%. But if you still held the asset today, 12 years later, you would be receiving over $1000 per year. That is a return of 10% on your initial investment, and if you went to recover your money, the shares would be worth substantially more, even though they are still yielding about 3%. During the COVID crisis, VYM went down 24.0%, in fact more than the total stock market index (down 20.8%), and has been slower to recover. However, in the 2022 inflation crisis, VYM has performed admirably – at its worst, down about 14% vs. 24% for the broader index.
I personally keep much of my “income growth” money in international dividend stocks – through the ETF SCHY. With companies like Deutsche Post, Unilever, British American Tobacco, and Roche – I feel pretty confident that I’m both inflation protected and receiving high yield.
So how do you put all this together?
As scary as the variations in principal are, remember income streams from these investments are reasonably consistent, and there is some chance of capital appreciation. If you could have avoided looking at what your investment was "worth" on any given day, and just held on through the ups and downs, you would have continued to collect pretty stable, and usually growing checks.
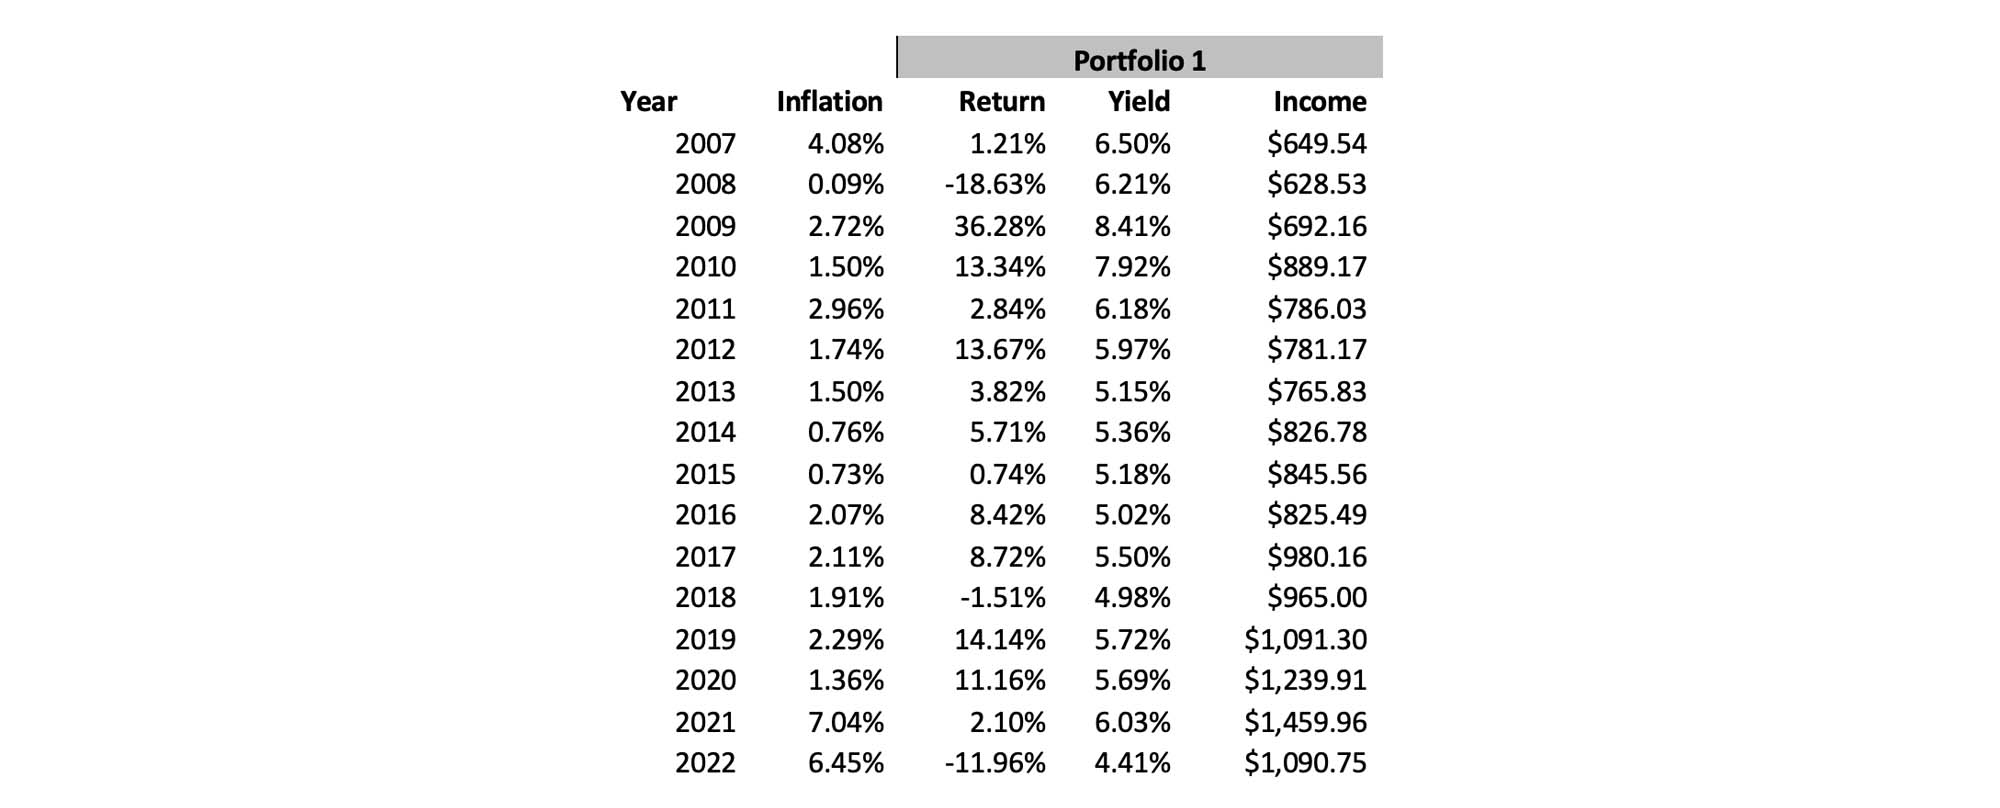
If you put $10,000 scattered across a variety of these strategies (about 10%-15% each). The value of your investment would look pretty terrible as you approached the end of 2008 - looks like you lost about 20% of your money!*. But the income only went down about 3%. 2022 the portfolio lost 12% and its income went down 25% - not ideal, but still far greater income than you would have received from “nominally protected” sources.
HOW TO EXECUTE THIS PLAN
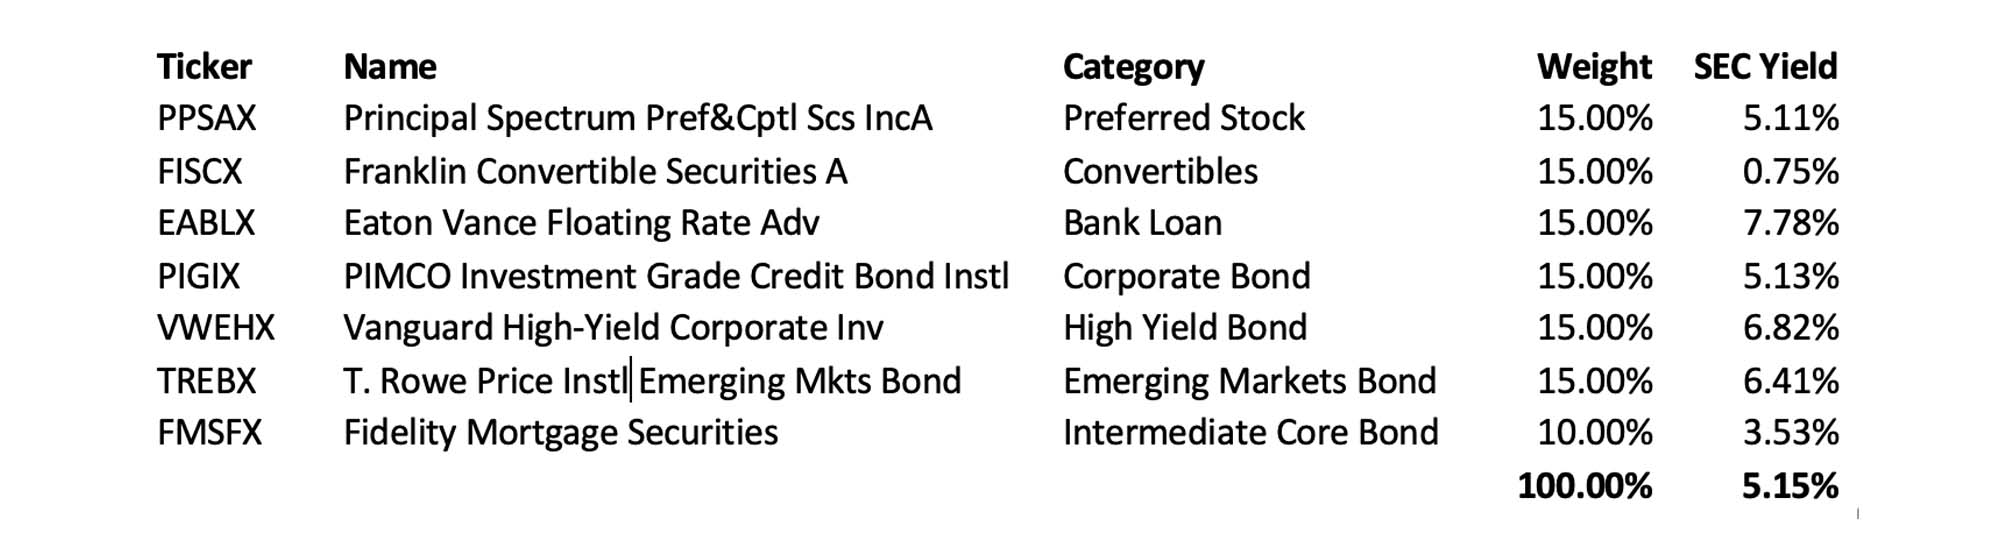
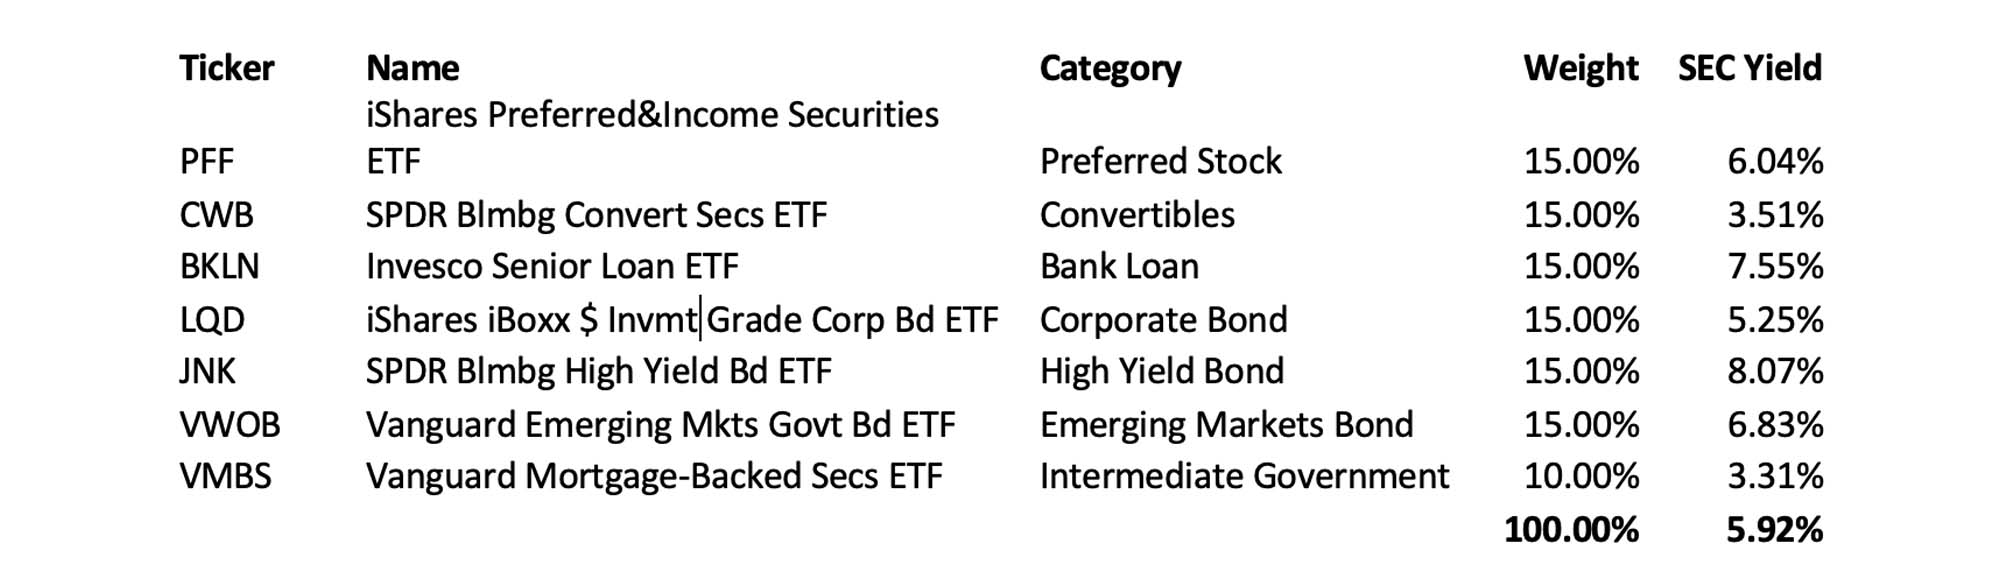
Option 1: Actually go and buy a bunch of ETFs or funds, spreading your risk between the different buckets above as you see fit. In this option, you would spread your money between 3-7 buckets in roughly equal portions. This DIY approach will have low investment costs.
Option 2: Hand it to the pros. I tend to be a fan of self management, but for this kind of income investing, there is a case to be made for outsourcing your job to a mutual fund with history of generating income for its investors through a diverse set of asset classes. I used to recommend PIMCO and it’s Income Fund – PONAX, however, it now charges almost 1% of sales – and its performance has lagged. Why might professionally managed still make sense for you?
First, these funds hold some securities that don’t publish daily asset prices. This reduces volatility as prices move more slowly.
Second, the funds have access to much more complex instruments than are available through the simple ETFs above, including ways to leverage certain assets to reduce the volatility of the portfolio.
Third, psychologically holding a bunch of different securities can drive you crazy – you will want to sell them as they go down, buy more as they go up, and just generally want to be “on top” of the investment. Having one asset that has maintained relatively consistent performance can be quite calming.
BONUS - TWEAKING FOR YOUR NEEDS
*for the purpose of this exercise in order to get history, I selected, at random, a handful of mutual funds that have been around for more than ten years. Here's the list, which by no means is a recommended list - it's just what I found that had long enough track records to make the analysis useful. We can do some optimizations to make this less volatile, but the point of this exercise was to show the relative steadiness of income investments vs. their principal.
The ETFs I listed above, since they are lower cost, are a slightly different mix, and because of a quirk in how convertible yield is calculated, have a higher yield 5.92% vs. the 5.15% listed above. Note – some differences in timing can change SEC yield calcs slightly. This mix could be tweaked depending on your goals. For example if you wanted to seek more income you might reduce mortgage securities and increase convertible and high yield securities. If you wanted more growth and cared less about principal protection, you would add in a dividend growth fund such as VYM and subtract some mortgage securities.
SIDEBAR: SAME INCOME, MORE PROTECTION, LESS LIQUIDITY
Note that if you place lower priority on quick access to the cash, several crowdfunding sites have historically offered better principal protection, including FundRise and YieldStreet. If you can tie the money up for several months to several years, you should consider these sites. Please check out my reviews of them to see if they are appropriate for you.